Titanium operates in the financial services industry. The group offers a wide range of financial services, mainly in asset management, loan financing and pensions. The group also manages a number of investment funds and structured financial products. Titanium was originally founded in 2009 and is headquartered in Helsinki.
Kvartalsrapporterne for Titanium-fondene levede godt op til vores forventninger, og der strømmede kapital ud af fondene på grund af indløsninger fra ejendomsfondene.
Titaniums regnskabsmeddelelse for 2. halvår indeholdt ingen større overraskelser, og det overordnede billede forbliver uændret. Situationen i ejendomsfondene er vanskelig, og presset for at lykkes med kapitalforvaltningen er stort.
Udbytteafkastet på Helsinki Børsen er faldende år-til-år. Der er udsigt til udbyttenedskæringer, men der er også højt udbytteafkast at finde hos udvalgte selskaber.
Indløsninger af ejendomsfonde ser ud til at være højere end forventet, og som følge heraf vil indtjeningsnedgangen i de kommende år blive dybere end tidligere. Selskabets pres for at lykkes med den nye kapitalforvaltningstjeneste er stort på grund af udfordringerne med ejendomsfondene. Hvis udvidelsen af kapitalforvaltningen lykkes, er der et klart potentiale i aktien, men i øjeblikket tynger risiciene tydeligt mere.
Titaniums månedsrapporter gav denne gang usædvanligt mange oplysninger. Regnskabsmeddelelsen gav konkrete oplysninger om omfanget af indløsninger i ejendomsfondene og lanceringen af kapitalforvaltningstjenesten. Indløsninger i ejendomsfondene ser ud til at blive større, end vi oprindeligt havde estimeret. Samtidig har PE-fonden fortsat sit gode salg, og formueforvaltningstjenesten ser ud til at være kommet positivt i gang. Dette er naturligvis ekstremt vigtigt, da den indtjeningsnedgang, der skyldes indløsninger fra ejendomsfondene, ser ud til at blive endnu dybere end forventet. Vores omfattende analyse, som vi offentliggjorde i sommer, kan læses her.
For asset managers on Nasdaq Helsinki, the trend has been mixed. The market situation has been very challenging for operators focusing on alternative investments, particularly real estate, while traditional asset management has continued to grow strongly.
For financial companies, 2025 has been very positive in terms of the operating environment, with strong capital market development and stabilized interest rates. However, the performance of the companies has been varying, and many companies we follow have suffered particularly from the subdued development of alternative investment returns (new sales and performance fees).
In this article, we review the quality of earnings of listed asset managers. In summary, the quality of earnings varies significantly within the sector, but on average, the level is quite good. The level has also improved in recent years, as the share of recurring fees has increased. We note that we have made the comparison at the group level, and thus the comparison does not account for the companies' differing business structures. We excluded Aktia from our review as the necessary information on its asset management is not available.
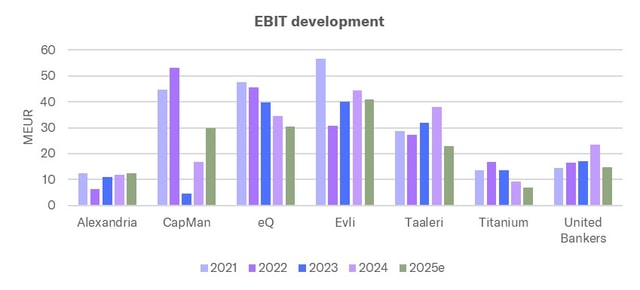
Asset managers' results declined sharply during the first half of the year. However, underlying factors include challenges in the real estate market and a decline in performance fees, and the operational development shown below has been largely positive. The outlook for the sector is positive, and as long as geopolitical risks remain in the background, companies in the sector are poised for robust earnings growth in the second half of the year.
The early part of the year has been moderate for asset management companies. Although stock prices are near their all-time highs in many places and interest rates have been in clear decline, market sentiment has been cautious, especially due to geopolitical tensions. Companies in the sector describe the early-year sentiment as mostly expectant. At the same time, however, the general tone of the comments has been cautiously positive.
Real estate has been one of the best performing asset classes in asset management over the past decade. This has been true for both investors and the companies that manage their investments.
Titanium published an H1 result clearly below our expectations in terms of the main lines. However, the revenue miss came mainly from non-recurring items, so the significance of the estimate undershoot remained small.