Witted Megacorp is an IT consulting company. The company offers a wide range of consulting services and IT solutions, mainly services related to project and business development. The solutions are used by a number of corporate customers in various sectors. In addition to the main business, various ancillary services are offered. The largest operations are found in the Nordic market.
Selskabets demonstrerede strukturelle rentabilitetsforbedring i 1. kvartal og den gode organiske væksttrend kombineret med en lav værdiansættelse skaber efter vores mening et attraktivt indgangspunkt for aktien.
Omsætningen forventes at vende tilbage til organisk vækst for første gang siden Q1'23, og vi forventer en bedre rentabilitet end i slutningen af sidste år og begyndelsen af indeværende år.
The IT service sector's Q3 earnings season began with cautious optimism, as the market looked for signs of a gradual turnaround in the IT service market. Unfortunately, the sentiment remained mostly cautious.
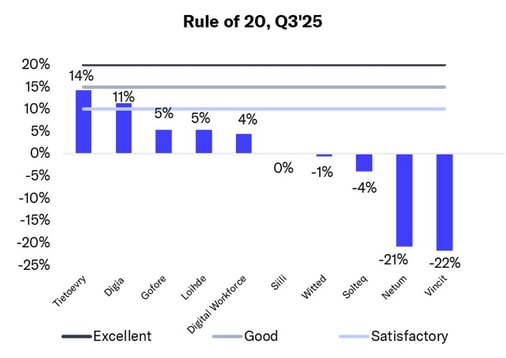
In the rest of the Nordic countries, organic revenue development turned downward and profitability weakened in Q2. Thus, even applying the Rule of 20, the situation in the IT services market remains distinctly challenging, with only one company achieving good performance and two achieving satisfactory performance.
The IT service sector entered the Q2 earnings season in a cautious mood, albeit with expectations of a turnaround. In reality, however, the situation deteriorated even further, with revenue falling more than before and beyond our expectations and profitability remaining at a very low level.
The IT services sector's Q1 earnings season was still approached with a cautious mood, but this time the reason was Trump's tariff threats. Possible tariffs would not directly hit the IT services sector, but they would certainly have an indirect impact through customer caution.