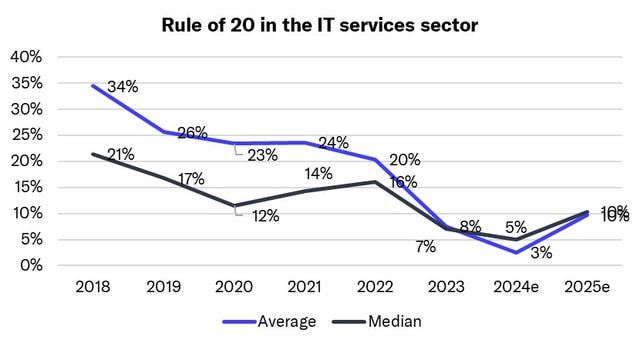
We are launching our own Rule of 20 for the IT services sector, which we believe works well, if not best, as a single parameter to measure the operational performance of the sector and especially of the companies.
Innofactor is already 94% owned by Onni Bidco following the takeover bid in November, and the redemption process for the remaining shares is underway. As a result, the company will be delisted in the coming months, and we will stop monitoring Innofactor's stock after the company terminated its research service agreement.
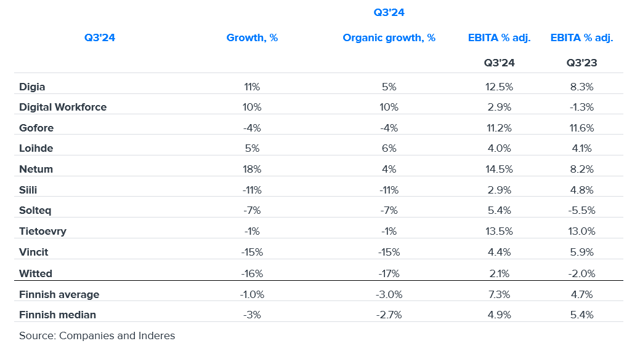
The IT services sector's Q3 results were met with a cautious mood after five companies in the sector issued profit warnings in just over a month. The decline in working day-adjusted organic revenue development for the sector's companies accelerated slightly as customers continued to economize, although the comparison period was already weak for most of them. Profitability, on the other hand, was significantly higher year-on-year, but the group was clearly divided between strong and weak performers.