Ovaro Kiinteistösijoitus focuses on real estate investments and in particular real estate development, primarily buying, developing and selling offices and land. Ovaro also owns and rents offices and apartments. The company operates in various parts of Finland, but focuses its operations on Finland's growth centers, i.e. university cities and the capital region.
Ovaros Q1'26-regnskabsmeddelelse var sæsonmæssigt svag og lå lige under vores estimater på bundlinjen. Selskabet gentog sine forventninger for 2026, og resultatudviklingen for resten af året er som sædvanlig baseret på fremdriften i udviklingsprojekterne. Vi mener, at projektpipelinen har taget klare skridt fremad, men stigende renter og potentielt inflationært pres har øget risikoen på kort sigt. Den balancebaserede værdiansættelse er absolut lav (2026e P/B 0,56x), men vi vurderer, at det forventede afkast forbliver på niveau med vores afkastkrav på grund af de førnævnte risici.
Bliv en del af Inderes community
Gå ikke glip af noget - opret en konto og få alle de mulige fordele
Inderes konto
Følgere og notifikationer om fulgte virksomheder
Analytikerkommentarer og anbefalinger
Værktøj til at sammenligne aktier og andre populære værktøjer
Fokus i regnskabsmeddelelsen er traditionen tro på fremskridtene i ejendomsudviklingsprojekterne i henhold til den nye strategi, hvis udvikling var positiv i begyndelsen af året.
Eskaleringen af krisen i Mellemøsten har øget inflationsforventningerne, hvilket har ført til en kraftig stigning i renteniveauet. Den højere rente rammer kernen i Ovaros strategi, som er baseret på genanvendelse af balancen og igangsættelse af nye projekter.
Selskabet estimerer et resultat på mellem 1,3-1,6 MEUR, hvilket er en klar forbedring år-til-år (0,6 MEUR), men lavere end vores nyligt opjusterede estimat (2,0 MEUR).
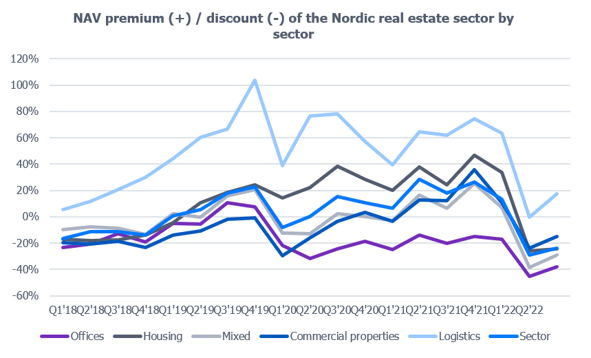
The share price development of Nordic listed real estate investment companies has been gloomy this year as the sector has declined by around 37% from the level at year end.