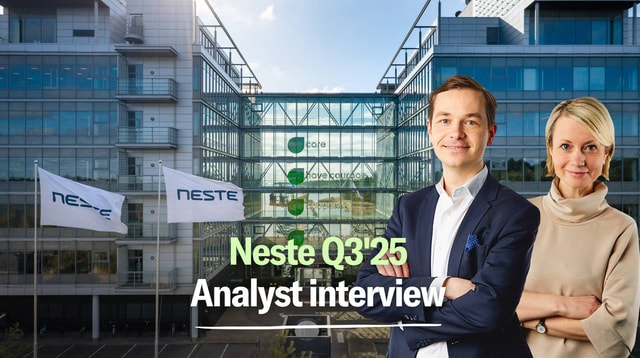
Neste

38,6EUR -0,72 %
18.931 investorer følger denne virksomhed

Neste is a manufacturing company. The company produces transport fuel and renewable fuels. Today, the largest operations and extraction are held in the Nordic market, where the company is active in the entire value chain, from extraction to delivery to port depots. In addition, the opportunity is given for direct sales where customers can pick up fuel at selected stations. The largest market is in the Nordic region, and the company is headquartered in Espoo.

P/E (23e)
13,49
EV/EBIT (23e)
13,74
P/B (23e)
3,28
Udbytteafkast, % (23e)
3,71 %
Kursmål
48.00 EUR
Anbefaling
Akkumulér
Opdateret
1.5.2023
NASDAQ Helsinki
NESTE
Daglig lav / høj pris
38,48 / 39,05 EUR
Markedsværdi
29,69 mia. EUR
Aktieomsætning
4,21 mio. EUR
Volumen
109 t
Risiko og anbefaling
HøjRisikoLav
SælgAnbefalingKøb

Resultatopgørelse

20192020202120222023e2024e2025e2026e
Omsætning15.839,9011.752,0015.148,0025.707,4025.289,9024.050,0023.775,0025.676,60
vækst-%6,18 %-25,81 %28,90 %69,71 %-1,62 %-4,90 %-1,14 %8,00 %
EBITDA2.731,401.508,102.607,003.047,302.990,243.584,643.702,394.097,00
EBIT (adj.)1.961,101.416,101.342,002.898,002.660,242.807,342.880,323.264,64
EBIT2.229,40828,102.023,002.409,002.293,242.807,342.880,323.264,64
Overskud før skat2.066,60786,801.962,002.278,002.209,242.696,482.811,733.224,77
Netto indkomst1.788,20712,401.771,401.887,001.881,252.236,082.331,742.674,56
EPS (adj.)1,981,611,433,022,862,913,043,48
vækst-%32,59 %-18,80 %-10,87 %110,44 %-5,08 %1,72 %4,28 %14,70 %
Udbytte1,020,800,821,521,431,501,551,74
Udbytte ratio43,79 %86,23 %35,55 %61,87 %58,43 %51,52 %51,06 %50,00 %

Profitability and return on capital

20192020202120222023e2024e2025e2026e
EBITDA-%17,24 %12,83 %17,21 %11,85 %11,82 %14,90 %15,57 %15,96 %
EBIT-% (adj.)12,38 %12,05 %8,86 %11,27 %10,52 %11,67 %12,11 %12,71 %
EBIT-%14,07 %7,05 %13,35 %9,37 %9,07 %11,67 %12,11 %12,71 %
ROE33,91 %12,03 %27,45 %24,66 %21,68 %23,28 %21,67 %22,11 %
ROI34,29 %11,46 %25,34 %24,49 %20,07 %23,22 %23,03 %24,20 %

Værdiansættelse

20192020202120222023e2024e2025e2026e
Share price (EUR)31,0259,1643,3643,0238,6038,6038,6038,60
Aktier767,68767,84767,97768,08768,08768,08768,08768,08
Markedsværdi23.813,5645.425,2433.299,1433.042,9329.648,0029.648,0029.648,0029.648,00
Enterprise value23.642,0645.181,0433.475,1434.386,9331.519,7030.773,7429.675,4328.162,72
EV/S1,493,842,211,341,251,281,251,10
EV/EBITDA8,6629,9612,8411,2810,548,588,026,87
EV/EBIT (adj.)12,0631,9124,9411,8711,8510,9610,308,63
EV/EBIT10,6054,5616,5514,2713,7410,9610,308,63
P/E (adj.)15,6736,8030,2614,2713,4913,2612,7111,09
P/E13,3263,7618,8017,5115,7613,2612,7111,09
P/B4,027,674,773,973,282,912,612,31
P/S1,503,872,201,291,171,231,251,15
Udbytteprocent3,29 %1,35 %1,89 %3,53 %3,71 %3,89 %4,02 %4,51 %
Equity ratio60,48 %60,42 %56,65 %56,34 %57,01 %63,40 %68,77 %70,47 %
Gearing ratio-2,89 %-4,12 %2,52 %16,14 %20,70 %11,06 %0,24 %-11,57 %

Kvartalsdata

Q2/22Q3/22Q4/222022Q1/23Q2/23eQ3/23eQ4/23e2023e
Omsætning7.039,306.583,006.562,4025.707,405.298,006.391,006.824,006.776,8825.289,90
EBITDA927,00455,60749,303.047,30463,00911,18815,57800,492.990,24
EBIT769,40289,00588,602.409,00285,00738,18642,57627,492.293,24
Overskud før skat749,60230,50562,602.278,00276,00713,18617,57602,492.209,24
Netto indkomst599,41135,99513,601.887,00238,00606,20524,93512,111.881,25