Inderes Group - October sales in line with SEB estimate - SEB

Inderes' sales grew by 5% in October, in line with our estimate. The growth was driven by Software and Research, while the company notes flat y/y sales in project revenue, i.e. events. All in all, well in accordance with our estimates and thus our read is neutral.
Sales grew 5% in October
Inderes reported this morning its sales data from October. The sales increased 5% y/y to EUR 1.9m, which is perfectly in line with our assumption. As expected the growth was driven by Software and Research businesses. We have pencilled in 27% y/y growth for Software in H2/26 and we note that the number of equity research contracts at the end of Q3 was up 7% y/y. However, the growth is offset by the event business, and the company notes flat y/y project revenue in October. Summing up, our take is neutral.
Inderes monthly sales (October'26 onward are SEB estimates), EURm
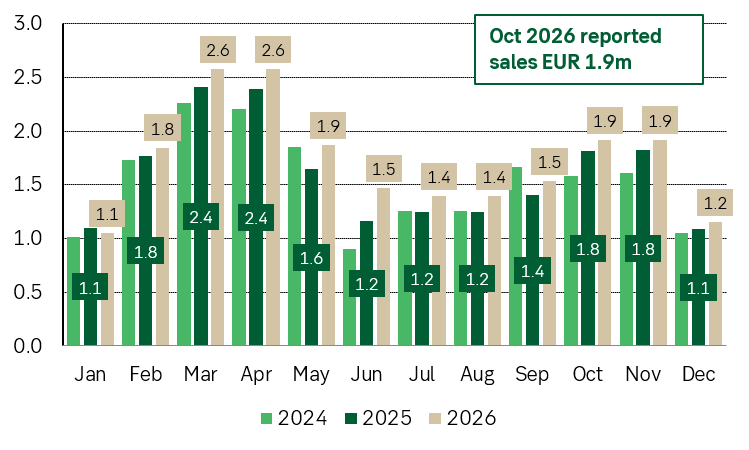
Source: SEB, Inderes
| Key figures | ||||
|---|---|---|---|---|
| (EURm) | 2025 | 2026E | 2027E | 2028E |
| Revenues (m) | 19 | 21 | 22 | 23 |
| Adj. EBIT | 2 | 3 | 3 | 4 |
| PTP (m) | 1 | 2 | 3 | 3 |
| EPS | 0.12 | 0.80 | 1.09 | 1.28 |
| EPS (adjusted) | 0.65 | 1.35 | 1.64 | 1.83 |
| DPS | 0.45 | 0.88 | 0.89 | 0.90 |
| Revenue growth (%) | 3.9 | 8.3 | 6.5 | 6.2 |
| EPS growth (%) | (31.0) | n.a. | n.a. | n.a. |
| Operating margin (%) | 4.7 | 9.6 | 11.7 | 12.9 |
| Adj. EBIT margin (%) | 11.3 | 13.0 | 14.9 | 15.9 |
| ROCE (%) | 29.7 | 44.2 | 55.3 | 57.4 |
| Net Debt/EBITDA (x) | (0.3) | (0.3) | (0.5) | (0.8) |
| PER (adjusted) | 24.1 | 12.4 | 10.2 | 9.1 |
| Dividend yield (%) | 2.8 | 5.3 | 5.3 | 5.4 |
| Free Cash Flow Yield (%) | 4.8 | 6.7 | 8.7 | 9.9 |
| P/BV (x) | 5.5 | 6.0 | 5.6 | 5.0 |
| EV/EBIT (x) | 12.5 | 10.2 | 8.1 | 6.8 |
| EV/Sales (x) | 1.41 | 1.33 | 1.20 | 1.07 |
| Source: SEB | ||||