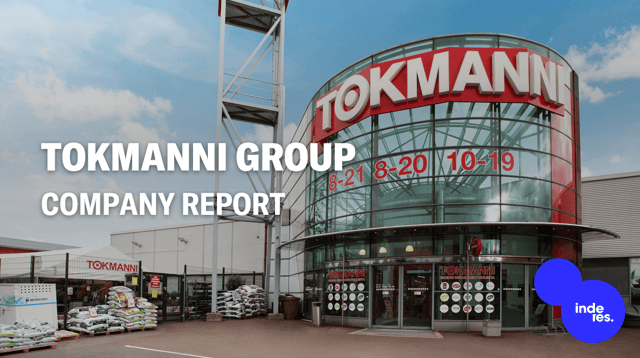
Tokmanni Group
12,75EUR -1,16%13.144 investorer følger denne virksomhed
Tokmanni Group is a Finnish retail chain. The Group's product range includes household products, food items, clothing, tools, and electronics and interior design products. The products include a number of external brands and part of the range is sold under the own brand. The group is mainly established around the Finnish domestic market. The company is headquartered in Mäntsälä.
P/E (23e)
12,81
EV/EBIT (adj.) (23e)
15,29
P/B (23e)
2,91
Udbytteafkast, % (23e)
6,12 %
Kursmål
14.00 EUR
Anbefaling
Akkumulér
Opdateret
20.11.2023
NASDAQ Helsinki
TOKMAN
Daglig lav / høj pris
12,64 / 12,96
EUR
Markedsværdi
750,58 mio. EUR
Aktieomsætning
1,61 mio. EUR
Volumen
127 t
Risiko og anbefaling
HøjRisikoLav
SælgAnbefalingKøb
Seneste analyser
Analyst

Arttu Heikura
Analytiker
Seneste videoer
Finanskalender
Årsrapport
22.03.2024
Generalforsamling
23.04.2024
Selskabsgennemgang
17.05.2024
Delårsrapport
16.08.2024
Selskabsgennemgang
15.11.2024
Major OwnersSource: Millistream Market Data AB
Owner | Capital | Votes |
---|---|---|
Takoa Invest | 17,9 % | 17,9 % |
Varma Mutual Pension Insurance Company | 4,2 % | 4,2 % |
Premium
Not activated
This content is for our Premium customers only.
Insider Transactions
Insider | Date | Total value |
---|---|---|
Mikko Bergman | 23.11.2023 | 192.465EUR |
Seppo Saastamoinen | 21.11.2023 | 1.884EUR |
Premium
Not activated
This content is for our Premium customers only.
Resultatopgørelse
2019 | 2020 | 2021 | 2022 | 2023e | 2024e | 2025e | 2026e | |
---|---|---|---|---|---|---|---|---|
Omsætning | 944,30 | 1.073,16 | 1.141,78 | 1.168,01 | 1.379,40 | 1.658,57 | 1.736,78 | 1.784,19 |
vækst-% | 8,49 % | 13,65 % | 6,39 % | 2,30 % | 18,10 % | 20,24 % | 4,72 % | 2,73 % |
EBITDA | 130,55 | 163,57 | 174,57 | 157,24 | 186,05 | 219,19 | 240,40 | 255,72 |
EBIT (adj.) | 70,40 | 99,55 | 105,69 | 85,74 | 96,19 | 119,15 | 135,86 | 142,66 |
EBIT | 69,40 | 98,95 | 107,74 | 84,04 | 92,65 | 119,15 | 135,86 | 142,66 |
Overskud før skat | 58,90 | 88,95 | 97,54 | 73,34 | 69,12 | 88,66 | 106,19 | 113,60 |
Netto indkomst | 47,10 | 71,25 | 77,98 | 58,76 | 55,04 | 70,04 | 83,89 | 89,75 |
EPS (adj.) | 0,82 | 1,22 | 1,29 | 1,03 | 1,00 | 1,19 | 1,42 | 1,52 |
vækst-% | 34,36 % | 49,44 % | 5,62 % | -20,37 % | -3,12 % | 19,57 % | 19,77 % | 6,99 % |
Udbytte | 0,62 | 0,85 | 0,96 | 0,76 | 0,78 | 0,80 | 0,83 | 1,07 |
Udbytte ratio | 77,49 % | 70,20 % | 72,48 % | 76,14 % | 83,43 % | 67,24 % | 58,00 % | 70,00 % |
Profitability and return on capital
2019 | 2020 | 2021 | 2022 | 2023e | 2024e | 2025e | 2026e | |
---|---|---|---|---|---|---|---|---|
EBITDA-% | 13,83 % | 15,24 % | 15,29 % | 13,46 % | 13,49 % | 13,22 % | 13,84 % | 14,33 % |
EBIT-% (adj.) | 7,46 % | 9,28 % | 9,26 % | 7,34 % | 6,97 % | 7,18 % | 7,82 % | 8,00 % |
EBIT-% | 7,35 % | 9,22 % | 9,44 % | 7,20 % | 6,72 % | 7,18 % | 7,82 % | 8,00 % |
ROE | 26,23 % | 35,45 % | 33,76 % | 23,90 % | 21,79 % | 25,93 % | 27,91 % | 26,43 % |
ROI | 14,74 % | 16,19 % | 16,99 % | 13,14 % | 10,94 % | 11,33 % | 12,80 % | 13,15 % |
Værdiansættelse
2019 | 2020 | 2021 | 2022 | 2023e | 2024e | 2025e | 2026e | |
---|---|---|---|---|---|---|---|---|
Share price (EUR) | 12,62 | 16,24 | 19,65 | 11,29 | 12,75 | 12,75 | 12,75 | 12,75 |
Aktier | 58,87 | 58,84 | 58,87 | 58,87 | 58,87 | 58,87 | 58,87 | 58,87 |
Markedsværdi | 742,92 | 955,60 | 1.156,77 | 664,63 | 750,58 | 750,58 | 750,58 | 750,58 |
Enterprise value | 1.123,10 | 1.288,40 | 1.471,07 | 1.047,93 | 1.471,15 | 1.451,53 | 1.452,99 | 1.432,54 |
EV/S | 1,19 | 1,20 | 1,29 | 0,90 | 1,07 | 0,88 | 0,84 | 0,80 |
EV/EBITDA | 8,60 | 7,88 | 8,43 | 6,66 | 7,91 | 6,62 | 6,04 | 5,60 |
EV/EBIT (adj.) | 15,95 | 12,94 | 13,92 | 12,22 | 15,29 | 12,18 | 10,69 | 10,04 |
EV/EBIT | 16,18 | 13,02 | 13,65 | 12,47 | 15,88 | 12,18 | 10,69 | 10,04 |
P/E (adj.) | 15,45 | 13,30 | 15,24 | 10,99 | 12,81 | 10,72 | 8,95 | 8,36 |
P/E | 15,77 | 13,41 | 14,84 | 11,31 | 13,64 | 10,72 | 8,95 | 8,36 |
P/B | 4,02 | 4,40 | 4,73 | 2,69 | 2,91 | 2,66 | 2,35 | 2,08 |
P/S | 0,79 | 0,89 | 1,01 | 0,57 | 0,54 | 0,45 | 0,43 | 0,42 |
Udbytteprocent | 4,91 % | 5,23 % | 4,89 % | 6,73 % | 6,12 % | 6,27 % | 6,48 % | 8,37 % |
Equity ratio | 25,27 % | 27,68 % | 29,97 % | 31,11 % | 20,89 % | 22,29 % | 24,53 % | 27,11 % |
Gearing ratio | 205,87 % | 153,14 % | 128,45 % | 155,19 % | 279,21 % | 248,39 % | 220,20 % | 189,39 % |
Kvartalsdata
Q4/22 | 2022 | Q1/23 | Q2/23 | Q3/23 | Q4/23e | 2023e | Q1/24e | Q2/24e | |
---|---|---|---|---|---|---|---|---|---|
Omsætning | 338,98 | 1.168,01 | 238,20 | 318,90 | 364,37 | 457,93 | 1.379,40 | ||
EBITDA | 51,79 | 157,24 | 17,46 | 48,54 | 49,61 | 70,44 | 186,05 | ||
EBIT | 32,99 | 84,04 | -2,04 | 28,74 | 23,01 | 42,94 | 92,65 | ||
Overskud før skat | 30,09 | 73,34 | -5,28 | 24,48 | 16,21 | 33,70 | 69,12 | ||
Netto indkomst | 24,19 | 58,76 | -4,28 | 19,64 | 12,71 | 26,96 | 55,04 |
ViserAlle indholdstyper