Yesterday, the arbitration court confirmed Project Grand Bidco's right to redeem the remaining Purmo shares, which resulted in the suspension of trading yesterday already before the start of the trading day.
Purmo is now 98% owned by Grand Bidco following the tender offer in August and the redemption proceedings for the remaining shares are underway. As a result, the company will be delisted in the coming months.
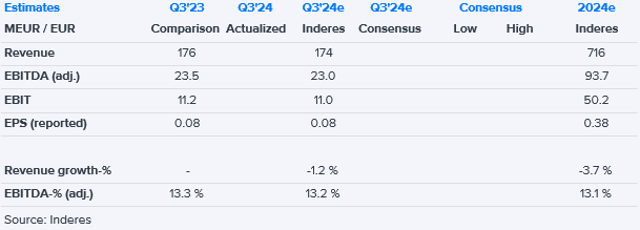
As expected, Purmo's Q3 revenue was close to the comparison period, but profitability was slightly below both the comparison period and expectations. The company reiterated its guidance and expects full-year adj. EBITDA to be in line or better than last year.
Purmo will report its Q3 results on Tuesday. The company is now 98% owned by Grand Bidco following the tender offer in August and the redemption proceedings for the remaining shares are underway. As a result, the company will be delisted in the coming months. The Q3 report will be the last in Purmo's stock market career, and we do not believe that its contents will have any further impact on the stock.