Componenta
2.3 EUR -4.56%3,906 investors are following this company
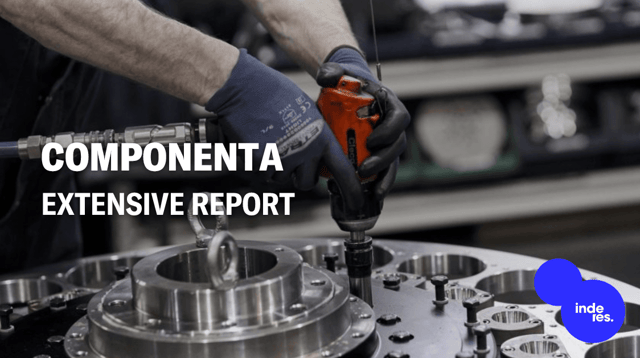
Componenta is a manufacturing company. The company is a supplier of casting solutions that are also used in a number of industrial vehicles, mainly trucks and larger machines. In addition to the main business, associated engineering services are offered. Componenta operates worldwide with the largest presence around the European market. The head office is located in Vantaa.
P/E (24e)
24.74
EV/EBIT (adj.) (24e)
12.27
P/B (24e)
0.84
Dividend yield-% (24e)
2.17 %
Target price
3.00 EUR
Recommendation
Buy
Updated
3.3.2024
NASDAQ Helsinki
CTH1V
Daily low / high price
2.3 / 2.38
EUR
Market cap
22.34M EUR
Turnover
48.04K EUR
Volume
21K
Risk and recommendation
HighRiskLow
SellRecommendationBuy
Latest research
Extensive report
Inderes' extensive report is an investor's handbook on customer companies covered by our research.
The latest extensive report was released
Read the reportAnalyst
Erkki Vesola
Analyst
Financial calendar
Business review
07.05.2024
Interim report
23.07.2024
Business review
01.11.2024
Major OwnersSource: Millistream Market Data AB
Owner | Capital | Votes |
---|---|---|
Joensuun Kauppa ja Kone Oy | 12.6 % | 12.6 % |
Etra Capital Oy | 9.7 % | 9.7 % |
Premium
This content is for our Premium customers only.
Insider Transactions
Insider | Date | Total value |
---|---|---|
Harri Suutari | 14.03.2024 | 62,023EUR |
Harri Suutari | 08.12.2023 | 45,844EUR |
Premium
This content is for our Premium customers only.
Income statement
2020 | 2021 | 2022 | 2023 | 2024e | 2025e | 2026e | 2027e | |
---|---|---|---|---|---|---|---|---|
Revenue | 70.0 | 87.3 | 109.1 | 101.8 | 106.3 | 111.3 | 117.0 | 123.4 |
growth-% | 38.0 % | 24.6 % | 25.0 % | -6.7 % | 4.4 % | 4.7 % | 5.1 % | 5.5 % |
EBITDA | 3.7 | 5.0 | 7.1 | 5.3 | 8.6 | 9.7 | 11.1 | 12.1 |
EBIT (adj.) | -2.9 | -0.8 | 1.8 | -0.4 | 2.5 | 4.0 | 5.6 | 6.5 |
EBIT | -2.0 | 0.0 | 1.6 | 3.8 | 2.5 | 4.0 | 5.6 | 6.5 |
Profit before taxes | -3.5 | -0.4 | -0.1 | 1.6 | 0.9 | 2.5 | 4.2 | 5.3 |
Net income | -3.2 | -0.4 | 0.1 | 1.5 | 0.9 | 2.5 | 4.2 | 5.3 |
EPS (adj.) | -0.43 | -0.13 | 0.03 | -0.27 | 0.09 | 0.26 | 0.43 | 0.55 |
growth-% | -1,116.1 % | 174.5 % | 68.2 % | 27.3 % | ||||
Dividend | 0.00 | 0.00 | 0.00 | 0.00 | 0.05 | 0.10 | 0.15 | 0.27 |
Dividend ratio | 53.8 % | 39.2 % | 35.0 % | 50.0 % |
Profitability and return on capital
2020 | 2021 | 2022 | 2023 | 2024e | 2025e | 2026e | 2027e | |
---|---|---|---|---|---|---|---|---|
EBITDA-% | 5.4 % | 5.7 % | 6.5 % | 5.2 % | 8.1 % | 8.7 % | 9.5 % | 9.8 % |
EBIT-% (adj.) | -4.2 % | -0.9 % | 1.6 % | -0.4 % | 2.4 % | 3.6 % | 4.8 % | 5.3 % |
EBIT-% | -2.9 % | 0.0 % | 1.4 % | 3.7 % | 2.4 % | 3.6 % | 4.8 % | 5.3 % |
ROE | -16.0 % | -1.7 % | 0.3 % | 6.3 % | 3.5 % | 9.0 % | 13.9 % | 15.8 % |
ROI | -6.1 % | 3.2 % | 4.3 % | 9.9 % | 6.5 % | 9.7 % | 12.6 % | 13.9 % |
Valuation
2020 | 2021 | 2022 | 2023 | 2024e | 2025e | 2026e | 2027e | |
---|---|---|---|---|---|---|---|---|
Share price (EUR) | 3.16 | 3.34 | 2.34 | 2.35 | 2.30 | 2.30 | 2.30 | 2.30 |
Shares | 9.5 | 9.5 | 9.7 | 9.7 | 9.7 | 9.7 | 9.7 | 9.7 |
Market cap | 30.0 | 31.8 | 22.7 | 22.8 | 22.3 | 22.3 | 22.3 | 22.3 |
Enterprise value | 27.5 | 38.5 | 27.5 | 31.9 | 31.2 | 29.4 | 26.7 | 23.5 |
EV/S | 0.4 | 0.4 | 0.3 | 0.3 | 0.3 | 0.3 | 0.2 | 0.2 |
EV/EBITDA | 7.3 | 7.8 | 3.9 | 6.0 | 3.6 | 3.0 | 2.4 | 1.9 |
EV/EBIT (adj.) | - | - | 15.6 | - | 12.3 | 7.3 | 4.8 | 3.6 |
EV/EBIT | - | 2,963.3 | 17.6 | 8.5 | 12.3 | 7.3 | 4.8 | 3.6 |
P/E (adj.) | - | - | 87.1 | - | 24.7 | 9.0 | 5.4 | 4.2 |
P/E | - | - | 372.6 | 14.7 | 24.7 | 9.0 | 5.4 | 4.2 |
P/B | 1.3 | 1.4 | 1.0 | 0.9 | 0.8 | 0.8 | 0.7 | 0.6 |
P/S | 0.4 | 0.4 | 0.2 | 0.2 | 0.2 | 0.2 | 0.2 | 0.2 |
Dividend yield | 2.2 % | 4.4 % | 6.5 % | 11.9 % | ||||
Equity ratio | 37.3 % | 42.3 % | 40.8 % | 44.6 % | 44.1 % | 44.9 % | 47.3 % | 50.3 % |
Gearing ratio | -10.8 % | 28.6 % | 20.2 % | 35.6 % | 33.6 % | 24.9 % | 13.9 % | 3.2 % |
Quarter data
Q1/23 | Q2/23 | Q3/23 | Q4/23 | 2023 | Q1/24e | Q2/24e | Q3/24e | Q4/24e | |
---|---|---|---|---|---|---|---|---|---|
Revenue | 30.7 | 29.5 | 19.9 | 21.7 | 101.8 | 24.2 | 26.2 | 25.5 | 30.5 |
EBITDA | 2.8 | 2.6 | 0.4 | -0.5 | 5.3 | 1.3 | 2.0 | 2.2 | 3.1 |
EBIT | 1.4 | 1.1 | 3.2 | -1.9 | 3.8 | -0.2 | 0.5 | 0.7 | 1.6 |
Profit before taxes | 0.9 | 0.5 | 2.7 | -2.5 | 1.6 | -0.6 | 0.1 | 0.3 | 1.2 |
Net income | 0.9 | 0.5 | 2.7 | -2.6 | 1.5 | -0.6 | 0.1 | 0.3 | 1.2 |
ShowingAll content types
Componenta Corporation’s Business Review 1 January–31 March, 2024: Net sales and EBITDA decreased
Componenta Q1 on Tuesday: 2024 off to a slow start
Join Inderes community
Don't miss out - create an account and get all the possible benefits
Inderes account
Followings and notifications on followed companies
Analyst comments and recommendations
Stock comparison tool & other popular tools